Baseline vs Current Schedule Comparison: How to Identify and Interpret Schedule Variances
Learn how to compare baseline and current construction schedules: what changes to look for, how to run the comparison in P6, and what each variance means for your project.
You’ve received the contractor’s monthly programme update. The project shows a three-week finish variance. The contractor’s narrative says “minor resequencing of works.” You approve the update. Three months later, you discover the contractor deleted 12 logic relationships, added hard constraints to eight activities, and changed the calendar on the critical path from a 5-day to a 6-day working week. The finish variance was hidden, not resolved. You’ve been tracking progress against a programme that no longer reflects the original plan.
That situation is common because most project teams look at the updated schedule in isolation. They check whether the completion date has moved, glance at the progress percentages, and move on. The real intelligence lies in the comparison between the baseline (the contractual commitment) and the current schedule (what’s actually happening). Treat this as one of the core moves of structured construction schedule analysis. This article shows you what changes between baseline and current, how to run the comparison in P6, and what each type of variance means for your project.
Why Compare the Baseline and Current Schedule?
The baseline programme is the contractual reference point. It’s the schedule the parties agreed represents the plan for delivering the project. Per the SCL Delay and Disruption Protocol, 2nd Edition, Core Principle 1 (Programme and records) and paragraph 4.7, the most recent Updated Programme, or the Accepted Programme if there is none, is the primary tool for assessing EOT entitlement. Paragraph 1.56 confirms that the Accepted Programme is regarded as ‘very important both for managing progress of the works and assessing any EOT applications’.
The current schedule (also called the update or progress schedule) reflects what has actually happened and what remains. It incorporates actual start and finish dates, remaining durations, and sometimes logic changes, calendar changes, and constraint additions.
Comparing the two tells you whether the project is tracking to plan, where it’s deviating, and whether those deviations are legitimate adjustments or problematic manipulations.
California’s High-Speed Rail project was approved in 2008 with a $33B budget. By 2024, the estimate exceeded $100B. Flyvbjerg and Gardner, in How Big Things Get Done, describe this as the classic “think fast, act slow” pattern: rushing into construction before planning was adequate. If anyone had rigorously compared the baseline to the evolving reality, the scale of the divergence would have been apparent years earlier. That’s what baseline comparison does: it reveals the gap between what was planned and what’s happening, before that gap becomes a crisis.
Callout box: The baseline is the contractual commitment. The current schedule is the reality. Comparing them tells you how far apart the two have become and whether that gap is being managed or hidden.
What Changes Between Baseline and Current Schedules
Eight categories of change can occur between the baseline and the current schedule. Each one affects the programme differently, and each one needs to be identified and understood.
| Change Type | What It Looks Like | Impact on Schedule Integrity |
|---|---|---|
| Activities added | New activities not in the baseline | May indicate scope creep or legitimate additions |
| Activities deleted | Baseline activities removed | May indicate scope omissions or improper removal |
| Duration changes | Original duration differs from actual or remaining | Extending durations may hide productivity issues |
| Logic changes | Relationships added, deleted, or changed | Can shift the critical path or mask delays |
| Calendar changes | Activity calendars reassigned | Switching calendars buys or loses time |
| Constraint changes | New constraints added or existing ones modified | Hard constraints override logic and suppress float |
| Date variances | Start or finish dates differ from baseline | Direct indication of schedule movement |
| Float changes | Total float values differ from baseline | Shows which paths have lost or gained flexibility |
Not all changes are problems. Some are legitimate responses to project conditions: a variation adds scope, a design change resequences work, weather delays push activities out. The issue is changes that aren’t visible, aren’t explained, or aren’t justified.
How to Compare Schedules in Primavera P6
Oracle Primavera P6 has built-in tools for baseline comparison. Here’s how to use them.
Assign the baseline
Before you can compare, you need to assign the baseline project.
1. Open the current project in P6
2. Go to Project > Assign Baselines
3. Select the baseline project for the Primary Baseline slot
4. (Optional) Assign a secondary or tertiary baseline for multiple comparisons
5. Click OK
You can assign up to three baselines (primary, secondary, tertiary) if you need to compare against multiple versions: the original baseline, a revised baseline, or a previous update.
Display baseline bars on the Gantt chart
Once the baseline is assigned, display the baseline bars alongside the current bars.
1. Open the Activities view with Gantt chart
2. Right-click the Gantt chart > Bars
3. Add or configure baseline bar(s)
4. Set the bar style: typically a thin line or shaded bar below the current activity bar
5. Apply distinct colour-coding (e.g. grey for baseline, blue for current)
6. Click OK
The visual comparison makes date variances immediately apparent. Where the current bar extends past the baseline bar, you have a finish variance. Where it starts later, you have a start variance.
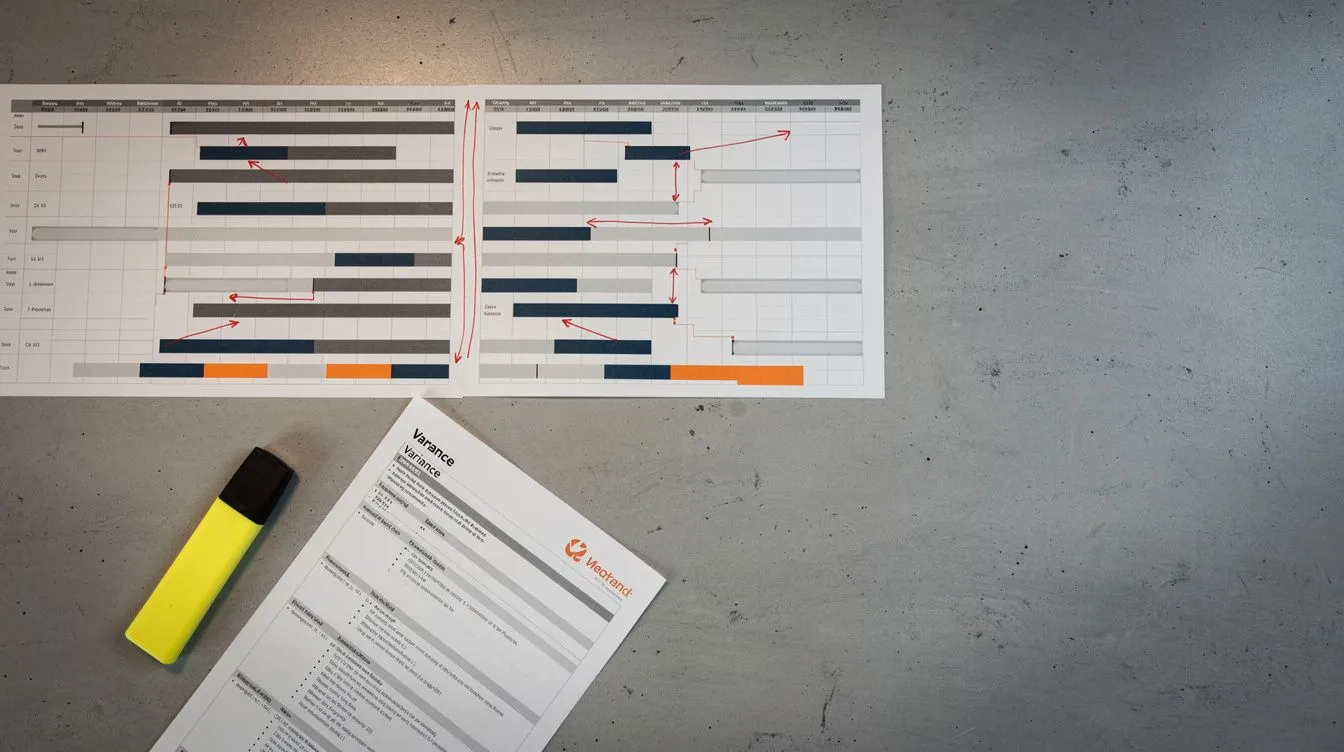
 Five activities with baseline (blue) and current (red) durations side by side. The numbered variance values show how many working days each activity has slipped against the baseline; the longer the variance, the further the path is from the original commitment.
Run variance columns
P6 provides built-in variance columns that calculate the difference between baseline and current dates.
| Column | What It Shows |
|---|---|
| Start Date Variance | Difference between baseline start and current start (positive = late start) |
| Finish Date Variance | Difference between baseline finish and current finish (positive = late finish) |
| Duration Variance | Difference between baseline duration and current duration |
| Variance at Completion | Difference between baseline finish and current finish for the project |
Add these columns to the activity table. Sort by finish variance in descending order to see which activities are running furthest behind the baseline.
Compare two XER files directly
Sometimes you don’t have P6 access, or you need to compare two separate XER files (for instance, the baseline export and the latest update export). In that case:
- ScheduleReader can open and compare XER files side by side without a P6 licence
- XER Toolkit offers a free browser-based comparison
- ScheduleLens automates the comparison and produces a change report covering additions, deletions, logic changes, constraint changes, and calendar changes
Comparing two XER files is especially useful during EOT assessments, where you need to demonstrate exactly what changed between the as-planned and as-built programmes.
What to Look For: Schedule Comparison Checklist
Use this checklist when comparing the baseline to the current schedule, alongside a broader process for reviewing a contractor’s programme. Not every item is a problem, but every change needs an explanation.
Activity changes
- Added activities. Are they legitimate (variations, new scope) or does the added scope indicate scope creep? New activities should map to approved changes.
- Deleted activities. Has scope been formally removed, or are activities being omitted from the programme without contractual authority?
- Duration changes. Have actual durations exceeded baseline durations? If so, is the remaining duration realistic, or has it been shortened to absorb delay?
Logic changes
Logic changes are the most consequential category because they can fundamentally alter the critical path.
- New relationships. Why was logic added? Does it represent a legitimate resequence or does it create a different critical path that avoids showing delay?
- Deleted relationships. Removing a logic link between activities can sever the chain that made an activity critical. Check whether deleted relationships were replaced or whether the network now has open ends.
- Changed relationship types. A Finish-to-Start (FS) relationship changed to Start-to-Start (SS) removes the dependency on the predecessor finishing. That can free up float on the successor path.
Constraint changes
Constraints are the most common tool for hiding delay. Per the DCMA 14-Point Assessment, metric 5, hard constraints (Mandatory Start On, Mandatory Finish On) shouldn’t exceed 5% of non-summary activities.
- New hard constraints. Are they justified (for instance, a statutory handover date) or are they overriding logic to show an artificial completion date?
- Changed constraint dates. Moving a constraint date forward can absorb variance that should be visible.
Calendar changes
Calendar changes are subtle but powerful. Switching an activity from a 5-day calendar to a 6-day or 7-day calendar effectively adds working time without changing the duration. The activity shows the same number of days, but it finishes earlier in calendar terms.
- Calendar reassignment. Has the calendar changed? If so, why? Is there a justification, or does it buy time on the critical path?
- Holiday and weather days. Are the calendars in the current schedule consistent with the baseline, or have weather days been removed from the working calendar?
Critical path shifts
The critical path in the current schedule should be compared to the critical path in the baseline. A shift in the critical path isn’t necessarily a problem; it happens as the project evolves. But it needs to be understood.
- Has the critical path moved to a different sequence of activities?
- Are there new critical activities that weren’t critical in the baseline?
- Have near-critical paths (activities with low float) become critical due to delay?
What we found: A shrinking critical path between submissions, without a corresponding change in performance, usually traces back to one of two things: logic relationships removed, or hard constraints added. Either change inflates float on activities the previous network identified as critical. The DCMA 14-Point’s metric 5 caps hard constraints at five per cent of activities precisely because constraints can override the network calculation without explanation.
What it means: A schedule that’s easier to read between updates isn’t necessarily more accurate. Where logic deltas and constraint deltas explain the change in the critical path, the path is being managed through the model rather than driven by construction sequence.
Interpreting Variance: What Does It Mean for the Project?
Variance is directionless without interpretation. A three-week finish variance could be a managed deviation with a clear recovery plan, or it could be the tip of an unmanaged collapse. Here’s how to think about it.
| Variance Type | Possible Meaning | What to Check |
|---|---|---|
| Positive finish variance (behind plan) | Genuine delay or inadequate productivity | Is the delay on the critical path? Does the remaining duration reflect reality? |
| Negative finish variance (ahead of plan) | Good progress or premature status reporting | Are claimed progress and actual progress the same? Check site records |
| Growing variance across updates | Systemic delay, not a one-off event | Is the rate of variance increasing? Compare current vs previous updates |
| Variance on non-critical path | Float consumption | Is the float being used up? When will this path become critical? |
| Zero variance but scope changes | Programme manipulation hiding variance | Check for logic changes, constraint changes, and calendar changes alongside date variance |
Cumulative variance trends
A single update’s variance tells you where the project is now. Comparing variance across multiple updates tells you where the project is heading. If the finish variance grows by five days every month, that’s a trend, not an anomaly. The PMI Practice Standard for Scheduling, Sections 3.3 (Schedule Model Maintenance) and 3.5 (Communication and Reporting), supports regular monitoring of schedule variance.
The Holyrood Parliament Building in Scotland was estimated at around £40 million at the start of construction and delivered at approximately £431 million, with the project opening around three years later than originally programmed (Auditor General for Scotland, 2004). While the circumstances were extreme (design changes, political interference, supply chain issues), the pattern of growing variance between planned and actual was visible in the contemporaneous reporting long before it became a crisis. The lesson is that cumulative variance, tracked against the baseline over time, provides early warning. Ignoring it doesn’t make it go away.
Schedule Comparison for Delay Analysis and EOT Claims
Baseline comparison isn’t just a project management exercise. It’s a forensic tool that feeds directly into EOT claim analysis. When a delay dispute arises, one of the first questions any delay analyst asks is: what changed between the baseline and the current schedule?
Per AACE International RP 29R-03, Section 5 (Choosing a Method), the selection of delay analysis method determines how the baseline and current schedules are used:
- Time Impact Analysis inserts delay events into the schedule as it stood at the time of the event. The comparison is between the unimpacted and impacted versions of the same update.
- As-Planned vs As-Built compares the entire baseline programme to the as-built programme, identifying all deviations.
- Windows Analysis breaks the project into time periods and compares what happened in each window to what was planned.
For EOT claims, the SCL Protocol (Guidance Part A paragraph 13 and Core Principle 5) requires the claimant to demonstrate that the Employer Risk Event impacts the critical path and is reasonably predicted to extend the contract completion date. The full extension of time claim process sets out how that demonstration is built and assessed; baseline comparison provides the evidence behind it: the original plan, the actual outcome, and the specific changes that connect the two.
Contemporaneous comparison means running the comparison at the time of each update, not retrospectively. This produces a contemporaneous record of what changed and when, which carries more weight in disputes than a retrospective reconstruction.
Common Issues Found in Schedule Comparisons
Some patterns appear repeatedly when comparing baseline to current schedules. Here are the ones to watch for:
| Issue | How It Appears | Why It Matters |
|---|---|---|
| Hidden logic changes | Relationships deleted or changed without explanation | Can shift the critical path to hide delay |
| Constraint abuse | New hard constraints that weren’t in the baseline | Overrides logic; the programme is date-driven, not logic-driven |
| Activity resequencing | Work moved to different locations in the network | May be legitimate but can also disguise work being out of sequence |
| Calendar manipulation | Calendars changed to add working days | Buys time on paper without actually increasing productivity |
| Duration compression | Remaining durations shortened despite lack of progress | Shows an earlier finish date that isn’t achievable |
| Float appropriation | Logic changes that move float from one path to another | Float belongs to the project, per the SCL Protocol, Core Principle 8 (paragraph 8.5), not to the party that finds a way to reallocate it |
Per the DCMA 14-Point Assessment, metrics 1 (logic), 5 (hard constraints), 6 (high float), and 7 (negative float) are particularly relevant to baseline comparison. A schedule that passes the DCMA checks on the baseline but fails them on the current update has deteriorated between the two, and that deterioration should be investigated.
Tools for Schedule Comparison
| Tool | Comparison Capability | Best For |
|---|---|---|
| Oracle Primavera P6 | Built-in baseline bars, variance columns, S-curves, earned value | Full comparison within P6 for users with a licence |
| ScheduleReader | XER baseline comparison without P6 | Viewing and comparing baselines in XER files |
| XER Toolkit | Free browser-based XER viewer | Quick checks without any software installation |
| ScheduleLens | Automated baseline vs current comparison, change detection across all eight categories, variance reports, critical path shift tracking | Comprehensive automated comparison with no manual setup; produces a change report showing every addition, deletion, logic change, constraint change, calendar change, and duration variance between baseline and current |
Key Takeaways
- The baseline is the contractual commitment. Every update should be compared back to it, not just reviewed in isolation.
- Eight categories of change can occur: activities added or deleted, duration changes, logic changes, calendar changes, constraint changes, date variances, and float changes. Each needs identification and explanation.
- Logic changes and constraint additions are the highest-risk changes: they can shift the critical path and hide genuine delay.
- Calendar changes are subtle. Switching from a 5-day to a 6-day week adds working time without changing durations.
- Track cumulative variance trends across updates. A growing variance is a trend, not an anomaly.
- Run the comparison contemporaneously, at each update, not retrospectively after a dispute has arisen.
- Use the DCMA 14-Point Assessment as a health check on both the baseline and the current schedule.
Comparing the baseline to the current schedule isn’t a bureaucratic step. It’s the single most reliable way to understand what’s changed on your project and whether those changes are being managed or hidden. If you’re receiving programme updates, you need to know what’s different from the plan, not just what the current plan says.